
CDAR is proud to announce the availability of exclusive marketplace statistical summaries generated from our REALTOR® member-only Desert Dynamics application. This new Monthly Market Summary will be published early each calendar month, with recent vital marketplace metrics for ease of sharing with your prospects and clients, or for printing and use in your business practice.
The new Monthly Market Summary will be published early each calendar month, with recent vital marketplace metrics for ease of sharing with your prospects and clients, or for printing and use in your business practice. These reports are exclusive to CDAR REALTOR® members only, meaning we are the only association offering this robust platform! Access to the reports can be found in Desert Dynamics under the Market Overview links in the menu dropdown. (You can find Desert Dynamics in the CDAR Dashboard or by searching “Desert Dynamics” in FLEXMLS – view our step-by-step tutorial further in this overview).
We highly recommend that you familiarize yourselves with our brand-new Monthly Market Summary reports, powered by Desert Dynamics and access these brand-new features that will allow you to highlight the market to prospective clients more efficiently than ever!
As of December 2024, the Monthly Market Summary reports were updated to include ALL Coachella Valley sales activity, and not only that of GPS member agents and firms.
Reported statistical results in the Monthly Market Summary include all Coachella Valley listings regardless of the native MLS from which they are sourced. In addition to Greater Palm Springs MLS, the MLSs included are CRMLS, CLAW (GPSR), Conejo / Simi / Moorpark, and Bridge (CA East Bay areas.)
With the rollout of the Monthly Market Summary, the CDAR Board of Directors discontinued the Desert Housing Report to membership. These dynamic reports, along with the Desert Dynamics platform, allow you to find all of the statistics you need for your business, and the analysis in a more granular setting that lets you show not just what’s happening in the desert cities, but the entire Coachella Valley region.
The first step in accessing these new reports is by accessing the Desert Dynamics product. You can get there both through the CDAR Dashboard and via the FLEXMLS Menu dropdown, under “Products.”

The one-page reports can easily be downloaded by logging into Desert Dynamics, expanding the top-left menu, and selecting the Market Overview Links button. Doing so brings up a clickable index of content by Geography and MLS Property Type.
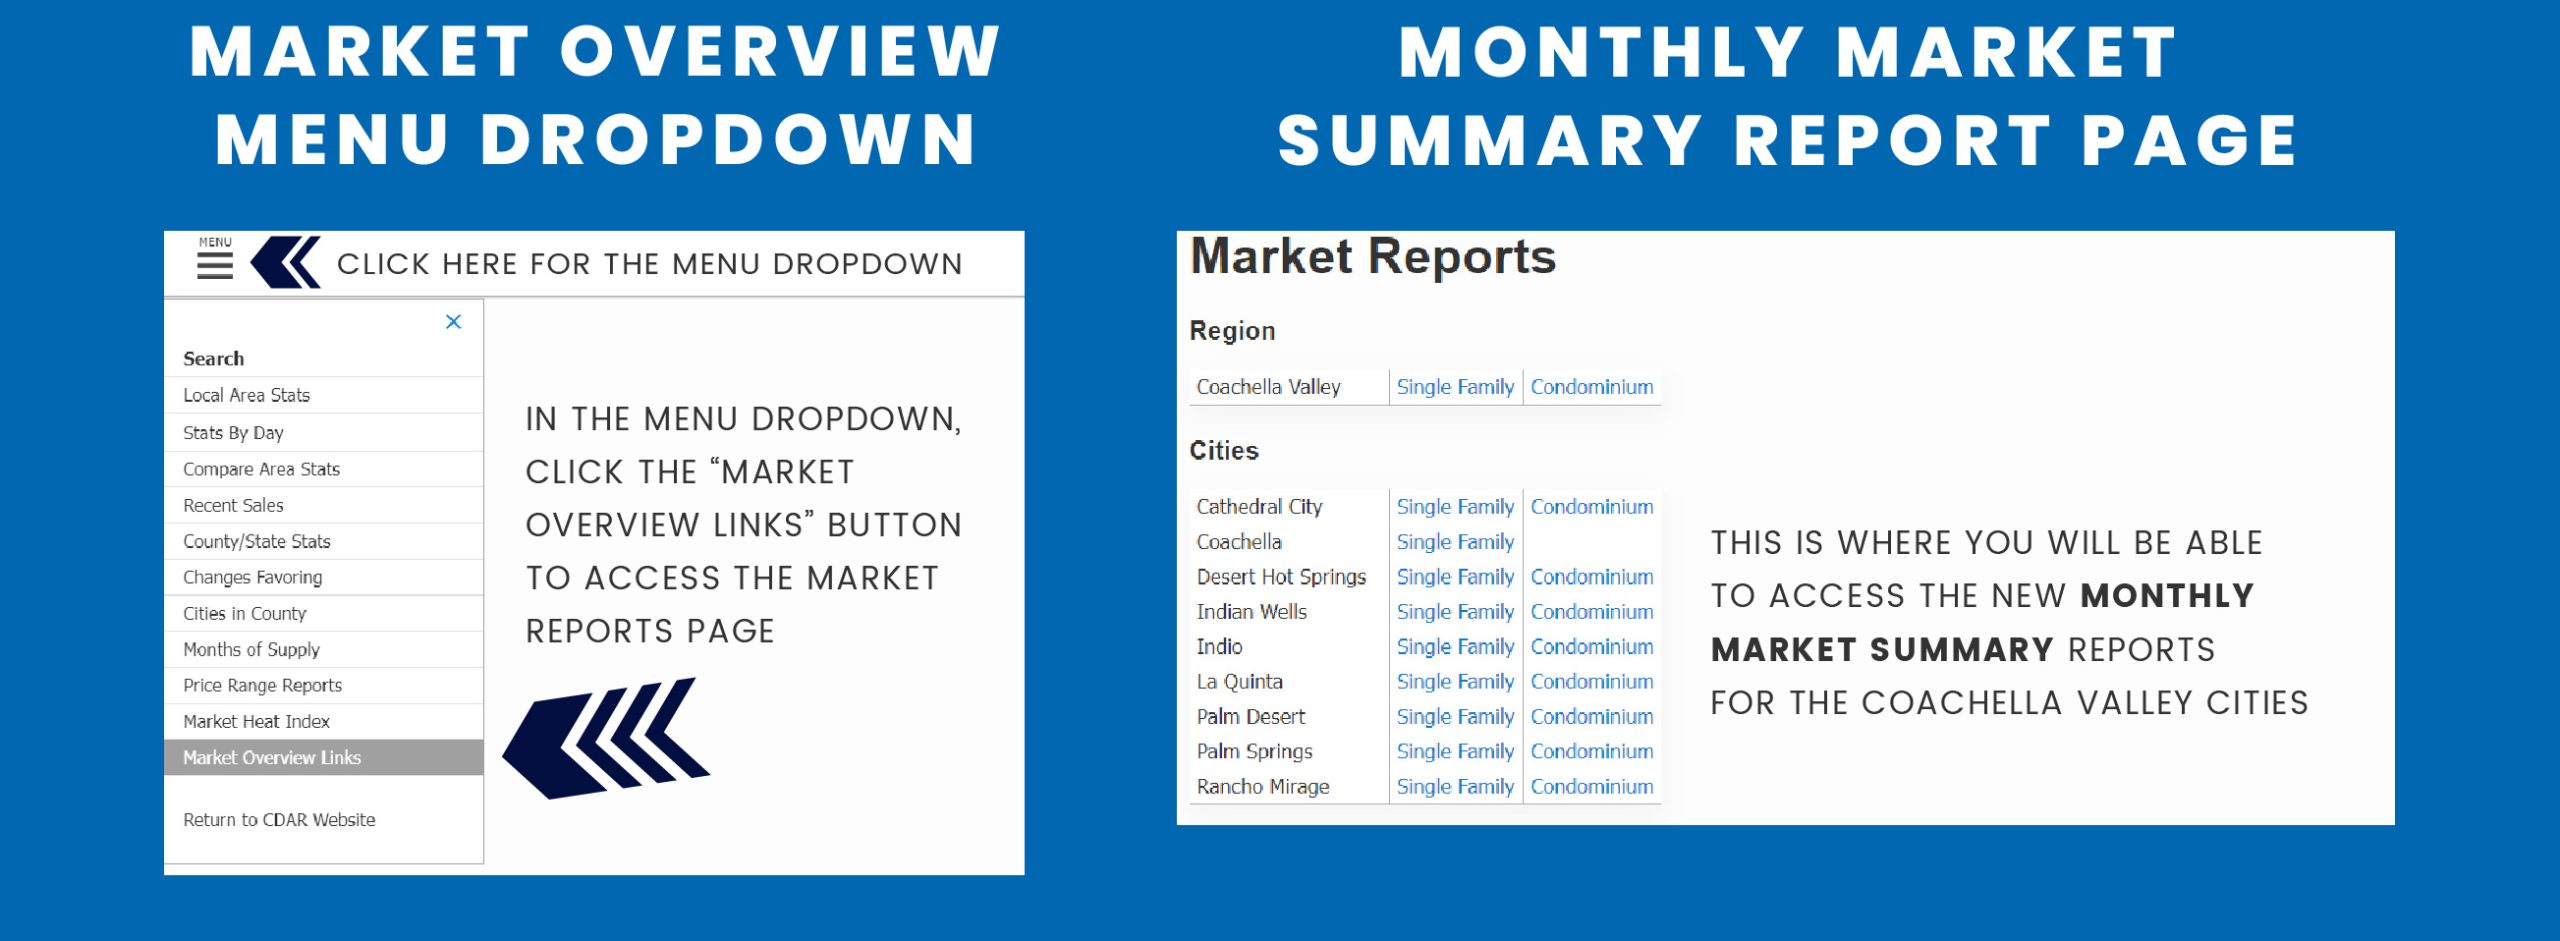
Selecting a link will load the one-page PDF document for each option, which can easily be downloaded. Members may then email or post these reports to their social media pages, or print them for use in listing presentations or other client consultation settings.”
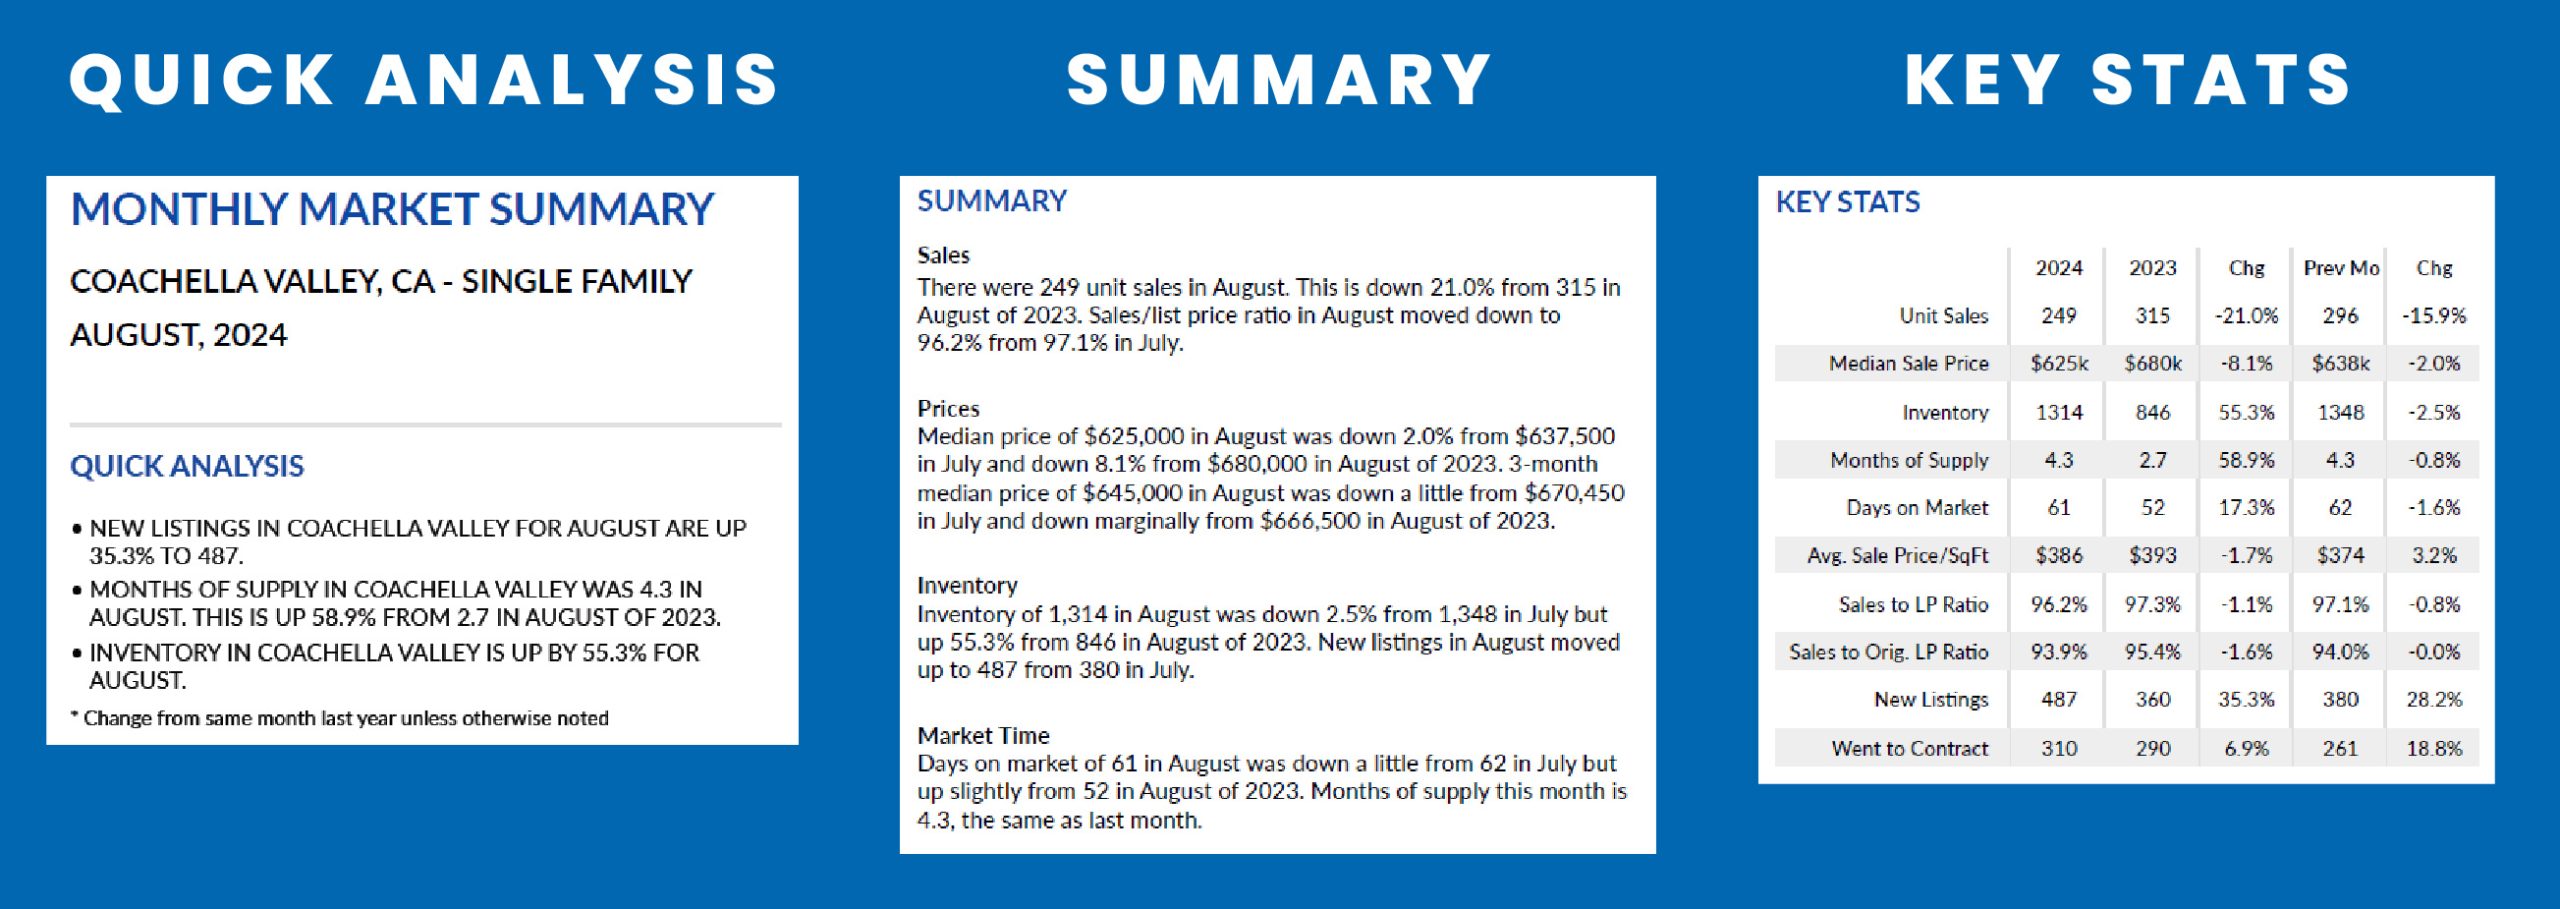
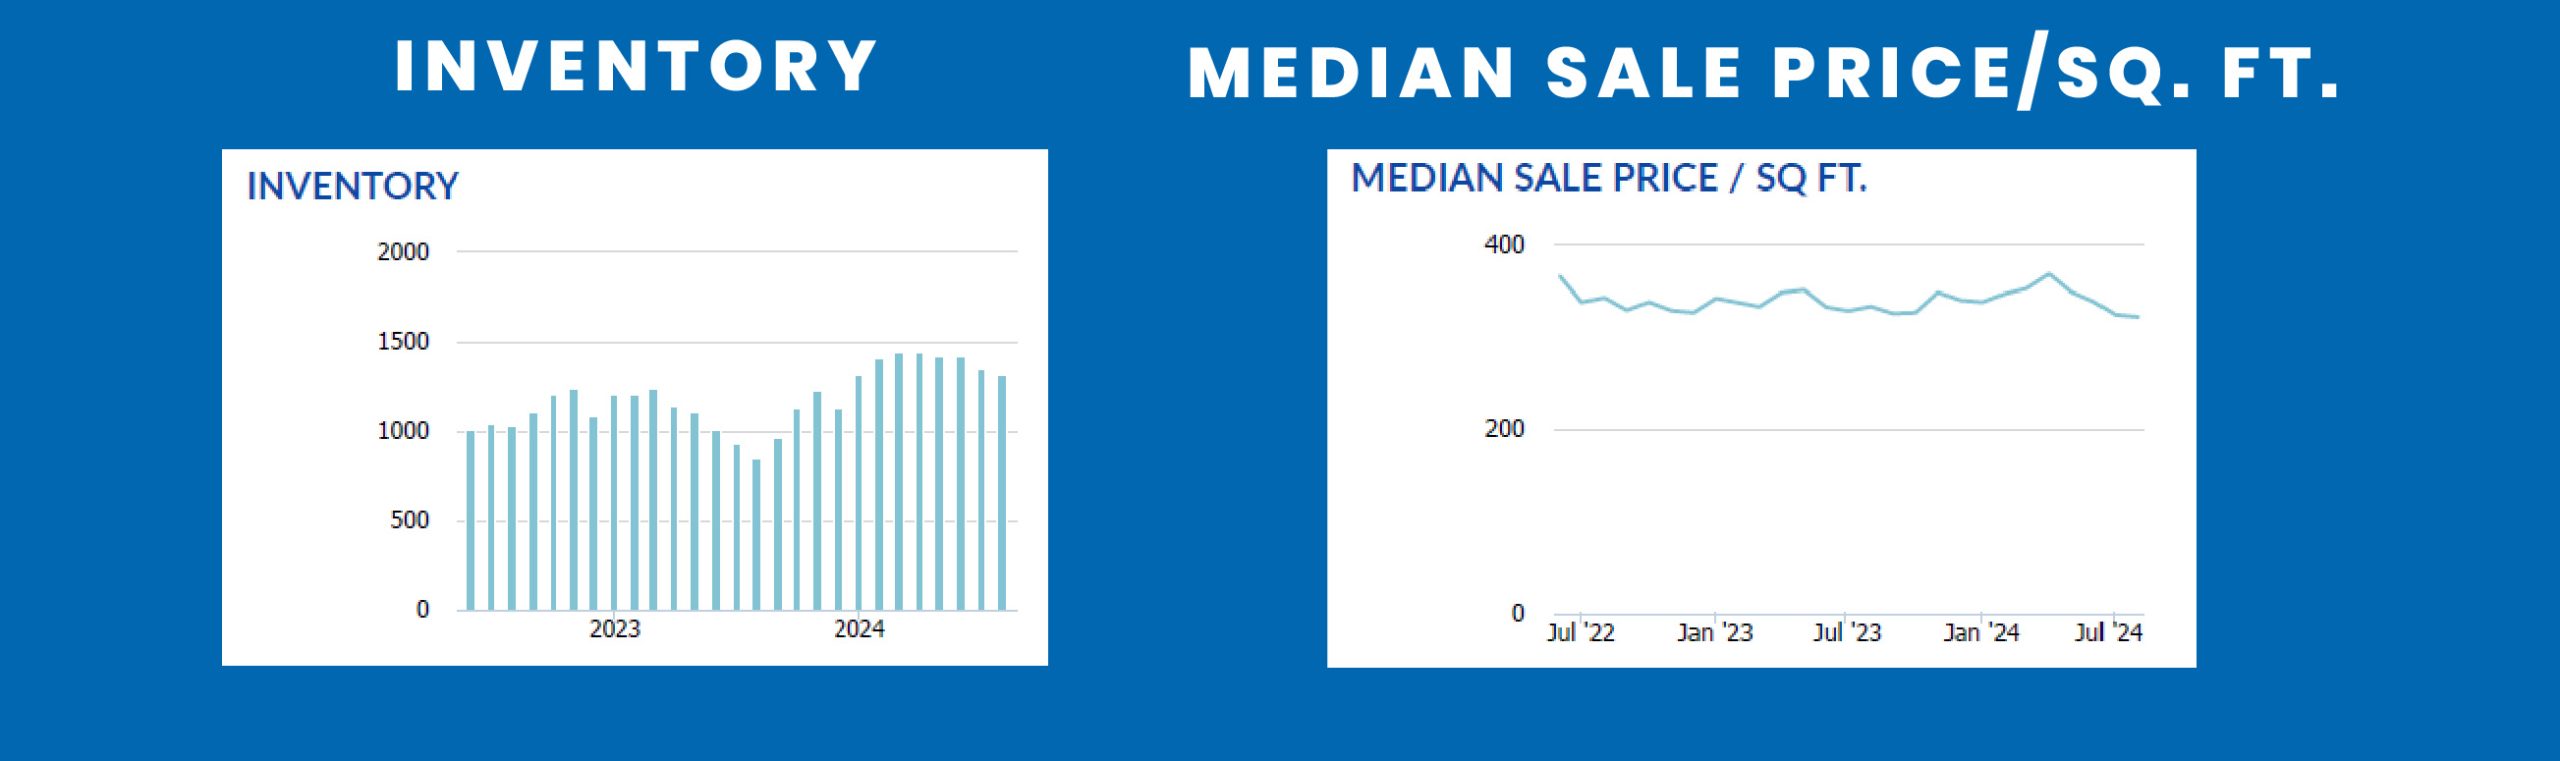
The reports include critical marketplace metrics and summary analysis for each market and property type as shown in this thumbnail image of a one-page report for Single Family Homes in the Coachella Valley Market Area.
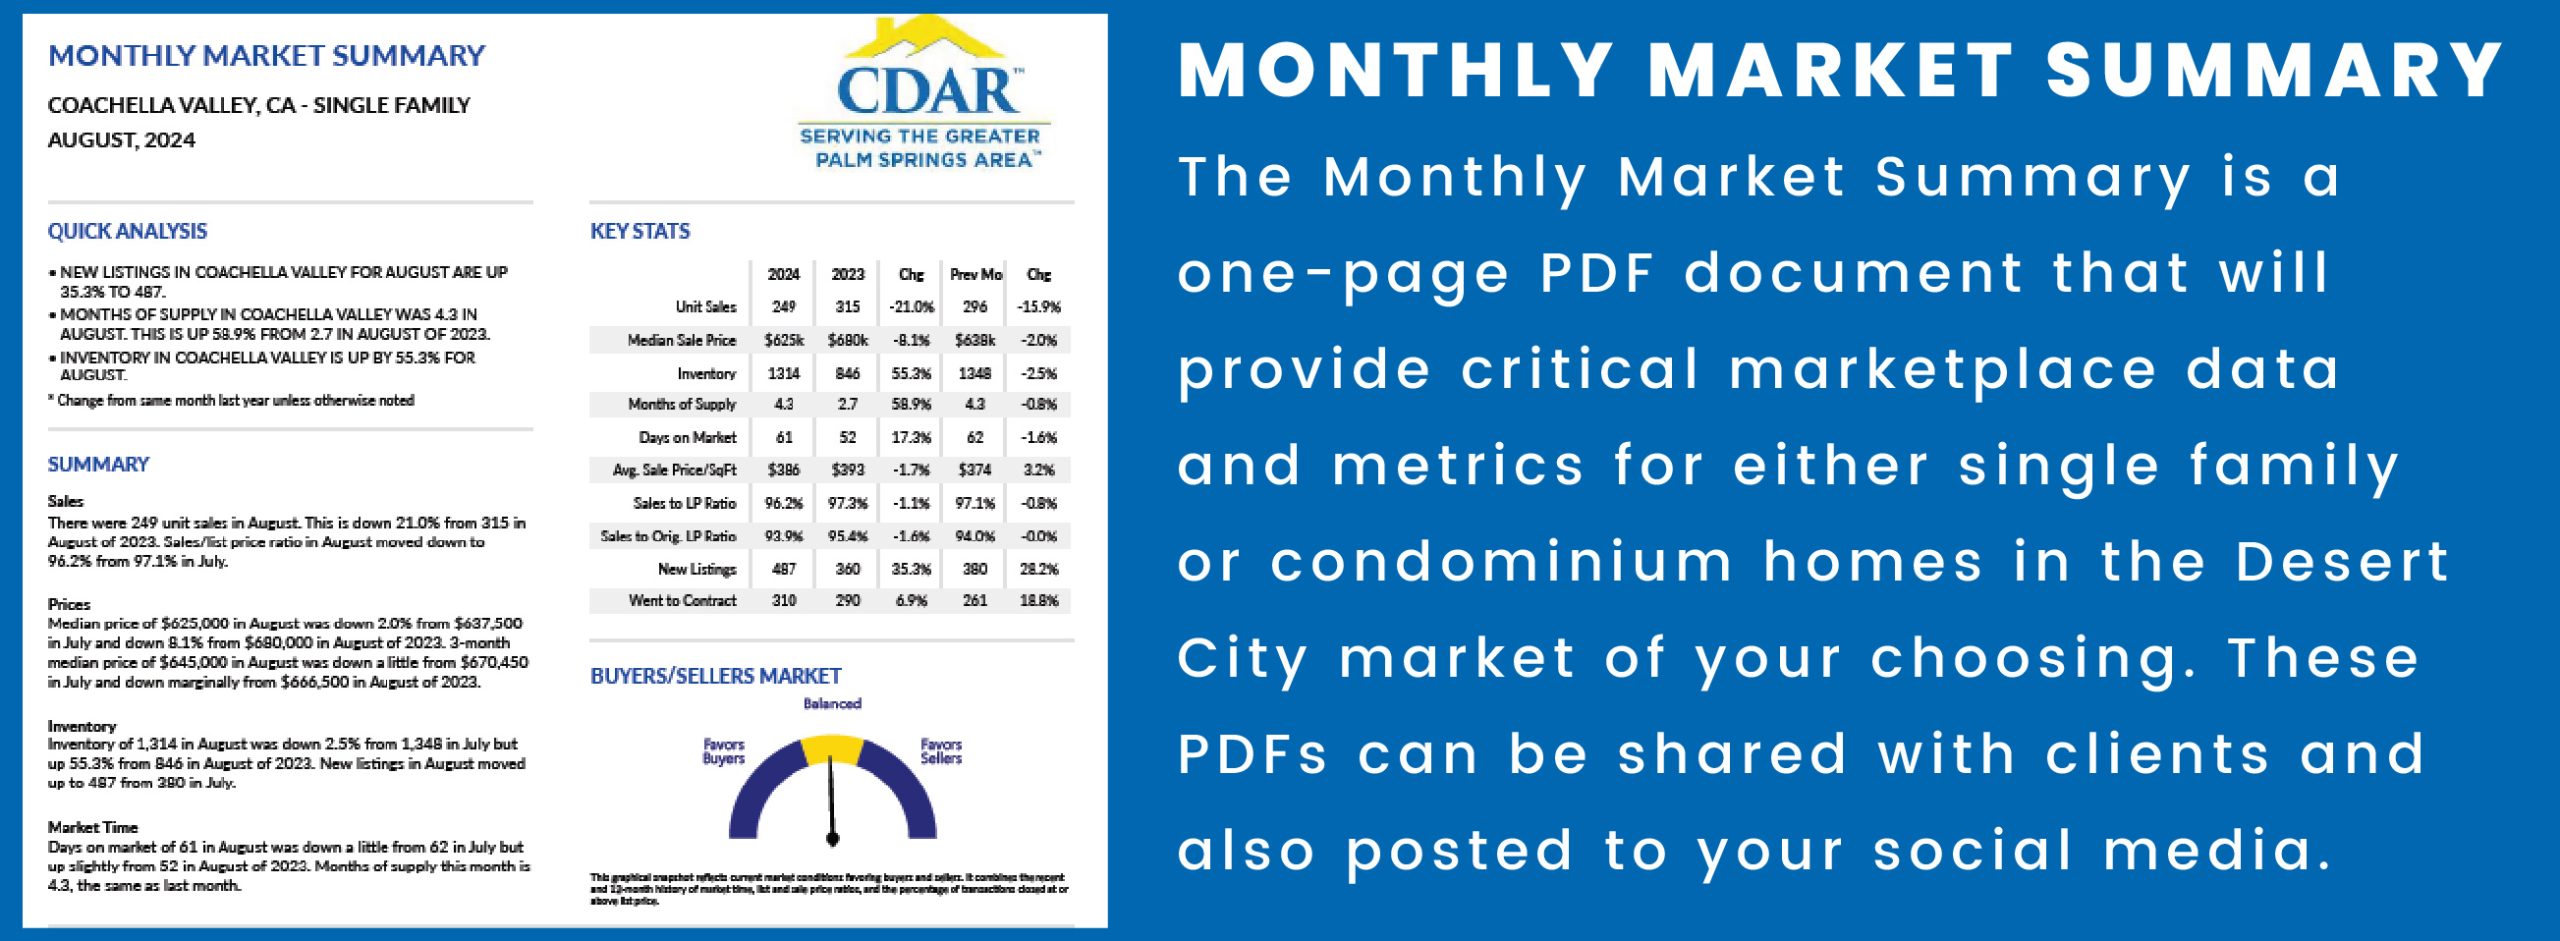
Let’s look more closely at each of the metrics and other elements of this example report for Single Family Homes in the cities which comprise the Coachella Valley.
CDAR leadership and partners have worked hard to design and publish a graphically oriented resource that allows you to better understand current market conditions, and to easily and effectively communicate those conditions to your prospects and clients. We hope that you also see the value and will put this exciting new tool to good use in your real estate business.
No. This is a member-only benefit provided free-of-charge to CDAR members. MLS-only members, or members of competing Associations of REALTORS, do not have this competitive advantage.
They will publish within a day or two after Desert Dynamics is updated, typically by the 6th or 7th business day of the month.
No. You may use the Desert Dynamics app via your MLS dashboard to download all of the reports, or only those that you wish to see and use. (Reports are small in file size and will not take up much space on your PC.)
You are encouraged to use these tools in consulting with your clients and prospects, in marketing your expertise, sharing information about our market via social media, and in other communications as long as you are a REALTOR-member of CDAR and as long as your use is compliant with MLS rules in effect at the time of use.
We carefully considered the sample sizes required for statistical accuracy of the results. Smaller samples sizes at the Country Club or subdivision geographies would be less reliable in this format. (You may see those results in the Desert Dynamics app, however.)
Coachella Valley is intended as a market-wide summary and aggregate of the cities served primarily by GPS MLS. Property cities provide more localized and targeted marketplace understanding. Property ZIP Codes are included for even more localized understanding within those cities having more than one ZIP Code. Cities having only one ZIP Code do not have a ZIP Code-level report.
These new tools and the Desert Dynamics application are intended to make access to and understanding of MLS marketplace statistics easy. We have very few requests for technical training as a result of this careful design and intended function. After release of these new tools, we will carefully monitor user activity and requests for training. However, if training is offered, it is less likely to be technical (related to access, downloading and / or sharing) than it is to be in interpretation of the results to improve members’ marketplace understanding and in their counseling with sellers and buyers.